Support and Resistance Trading Strategy
Support and resistance levels are essentially psychological zones of demand and supply, and identifying them is one of the most critical aspects of technical analysis.
📈 What is Support and Resistance?
Support is a price level where buying pressure tends to prevent further decline, effectively acting as a floor. Resistance is a level where selling pressure typically halts price advances, acting as a ceiling. When the price breaks through either level, it often signals a potential trend continuation or reversal.
■ Support levels are historical price points at which an asset or index has shown difficulty falling below. At these levels, many traders tend to buy the market (enforced demand).
■ Resistance levels are historical price points at which an asset or index has shown difficulty breaking through. At these levels, many traders tend to sell the market (enforced supply).
Support & Resistance Timeframes
Traders must always be aware of the nearby support and resistance levels relevant to their trades, regardless of the timeframe.
■ Short-Term Support & Resistance (one day to one month)
■ Mid-Term Support & Resistance (one month to one year)
■ Long-Term Support & Resistance (one year to several decades)
Support and resistance levels do not change in the same way as oscillators or trendlines. These levels are generally characterized by their stability over time.
📝 How Are These Support & Resistance Levels Formed?
In technical analysis, trend lines are diagonal lines drawn by connecting key swing lows in an uptrend or swing highs in a downtrend. These lines visually represent support and resistance levels and help identify the overall market direction. An uptrend is defined by a series of higher highs and higher lows, while a downtrend is characterized by lower highs and lower lows.
When the price consistently fails to break through a specific level—touching it at least twice and reversing—it suggests strong supply or demand at that point. In such cases, a horizontal line is drawn instead of a diagonal one to mark static support or resistance.
By connecting these significant highs and lows—either with angled or horizontal lines—and extending them forward on the chart, traders can highlight dynamic (angled) or static (horizontal) zones where price is likely to react. These zones often indicate areas of past buying or selling pressure that may influence future price movements.
Support and resistance levels are essentially psychological zones of demand and supply. The more times an asset or index fails to break through certain price levels, the stronger the perception of established support or resistance at those points.
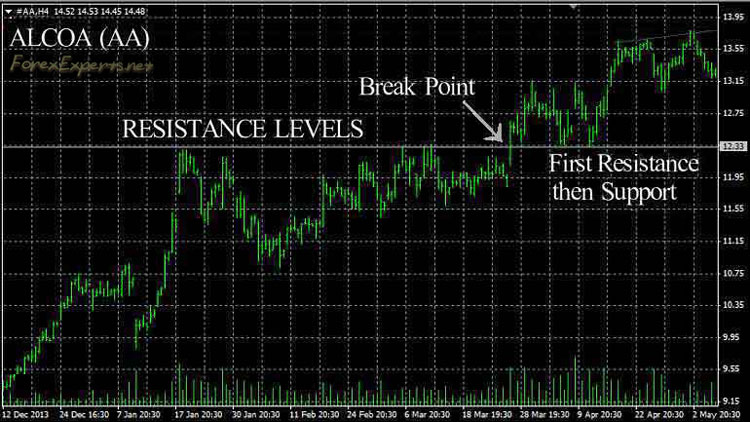
Chart: Support Levels


Chart: Resistance turns into Support
♞ Designing a Support & Resistance Strategy
Support and resistance trading strategies aim to capitalize on the increased demand and supply present at key support and resistance price levels.
Implementing the Support & Resistance Trading Strategy
When the price of an asset is testing an important support or resistance level, the strategy involves trading in the opposite direction.
■ If the price of an asset is testing a major support level, buy a Call Option (↑)
■ If the price of an asset is testing a major resistance level, buy a Put Option (↓)
Trading Strategy Confirmation
Confirmation comes from a notable increase in trading volume at specific price levels.
Using the Right Timeframe
The most critical step in applying this strategy is accurately identifying support and resistance within the appropriate timeframe. Attempting to trade against significant long-term support or resistance using a short-term setup will likely result in failure. You must align your trades with the correct timeframe. For instance, if you trade 5-minute High/Low options, you should use support and resistance levels from a short-term chart.
How to Define Important Support or Resistance
The best chart types for identifying support and resistance are candlestick and bar charts. You can either find major support and resistance levels online or create your own support and resistance tables. Studying historical charts is essential for determining these levels independently. A basic understanding of technical analysis is required.
Support and Resistance on EURUSD
Below is a table showing EURUSD support and resistance levels. This table was originally published on one of my other websites, TradingCenter.org. These levels are provided for educational purposes only.
Table: EURUSD Long-Term Support & Resistance 1991–2013
|
PRICE LEVEL |
IMPACT |
YEAR |
|
1.6000-1.6040 |
VERY STRONG |
2008 |
|
1.5151 |
STRONG |
2009 |
|
1.4941-1.4971 |
STRONG |
2011 |
|
1.2425-1.2426 |
STRONG |
Several years |
|
1.2310-1.2370 |
STRONG |
Several years |
|
1.2100-1.2140 |
STRONG+ |
PERIODIC PIVOT (H/L) 1.21305 |
|
1.2035-1.2040 |
AVERAGE |
2012 |
|
1.1603-1.1604 |
STRONG- |
1992 |
|
0.8200-0.8230 |
VERY STRONG |
2000 |
The Safest Way to Trade the Support and Resistance Strategy
The safest way to trade using this strategy is when a major support or resistance level has already been tested. This means the price of an asset has reached a key level and has begun moving in the opposite direction.
Fast Response on Trade Execution
If you are trading Turbo Options using a support and resistance strategy, speed is essential. Typically, when an asset tests a support or resistance level, it reverses direction quickly. You must act fast to enter at the optimal price level and increase your chances of success.
Price Ranges Formed Between Support and Resistance
An asset's price usually moves within a range defined by the first significant support level (lower boundary) and the first significant resistance level (upper boundary).

Support and Resistance Derived from Round Numbers
Round numbers have a traditional influence on demand and supply across all markets. This is a purely psychological factor with a proven impact. Round numbers include prices ending in multiple zeros—for example, 1.3500 for EURUSD, or $50, $100, and $150 for stocks or commodities. Financial assets often struggle to break through round numbers immediately. These levels typically provide reliable support and resistance. However, you need experience with specific assets to accurately assess the influence of round numbers. In Forex trading, for example, a currency rate often breaks 50 pips past a round number before reversing direction.
This psychological effect also applies to mid-level numbers:
■ Round Number: 1.3400, 1.3500
■ Middle Number: 1.3450
Support and Resistance Derived from Moving Averages
Moving averages are a widely used technical analysis tool. A moving average represents the average price of an asset over a specific period.
Example: 200-Day Simple Moving Average
The 200-day moving average is calculated by summing the closing prices of the past 200 trading days and dividing the total by 200.
Common Moving Averages
The most commonly used moving averages are the Simple Moving Average (SMA) and the Exponential Moving Average (EMA). The most frequent periods applied include:
■ 34 trading periods
■ 50 trading periods
■ 200 trading periods
Moving averages form a constantly shifting curve that can act as either support or resistance.
Support and Resistance Strategy
Trading liquid financial assets using key support and resistance levels can be profitable. However, the key to success lies in how accurately and quickly you can apply the strategy. If you’re a beginner, be sure to test it using a practice account. As with any trading strategy, avoid risking too much on a single trade—never risk more than 5% of your balance on any one position. The market can always behave unpredictably, regardless of your skill or experience.
◙ Support and Resistance Trade Strategy
ForexExperts.net (c)
🔗 READ MORE
» Introduction to Trading Strategies
♞ DAY-TRADE STRATEGIES
» Falsebreak Candle
» Bollinger-RSI
» Stochastic Day-Trade
» Breakout Strategy
♚ SWING-TRADE STRATEGIES
» Riding the Trend
» Moving Envelopes
» MACD Swing
♜ SCALPING STRATEGIES
» Stochastic Scalper
» Bollinger-RSI Scalping
» Hit-Run Trading
♟ STRATEGIES FOR BEGINNERS
» News-Trading
» Follow-The-Trend
» Support and Resistance
» Fibonacci Retracements
» Stochastics Trading
» Chart Patterns
💱 MARKET CORRELATIONS
» US Yields and USDCHF
» Crude Oil and Forex
» USDJPY and US Stock Indices
» AUD and Gold Price Correlation