Fibonacci Retracements Trading Strategy
This is a price-reversal strategy based on predefined retracement levels, as you will see below. The Fibonacci method is a purely technical analysis approach derived from the Fibonacci number sequence.
📈 Information -What is the Fibonacci sequence of numbers?
Fibonacci was a famous Italian mathematician who lived during the late 12th and early 13th centuries. He introduced the Hindu-Arabic numerical system to Europe. The Fibonacci sequence is a series of numbers where each number is the sum of the two preceding ones. Here are the first 12 numbers of the Fibonacci sequence:
■ 1, 2, 3, 5, 8, 13, 21, 34, 55, 89, 144, 233
This sequence is directly connected to the Golden Ratio, also known as Phi or Φ (Φ = 1.61803…). The number 1.618 appears throughout the universe: in the distances between planets in our solar system, in nature on Earth, in human anatomy, and even in global financial markets. In this article, we will focus solely on Fibonacci retracements, not on the Golden Ratio’s influence on financial markets.
🔗 More at TradingFibonacci.com:
♞ The Fibonacci Retracements Trading Strategy
The Fibonacci Retracement Levels
The Fibonacci Retracement Strategy is a pure price reversal trading approach based on specific price retracement levels. The three key Fibonacci retracement levels are:
■ 38.2% (less significant level)
■ 50.0% (important level)
■ 61.8% (highly important level)

📝 Designing the Fibonacci Retracements Strategy
As mentioned earlier, this is a purely technical analysis strategy that helps traders identify potential price reversals.
To implement this strategy, you need a platform that allows you to place Fibonacci retracements on charts. Almost all trading platforms today include the Fibonacci retracement tool.
Step 1: Applying the Fibonacci Retracements on a Chart
First, select the price chart of the asset you are interested in and choose the appropriate timeframe (ranging from a few minutes to several hours). Then, apply the Fibonacci retracement tool from the menu at the top of the platform. Applying the tool is simple—you just need to place two points on the chart:
Locating the Minimum and Maximum Points of the Swing:
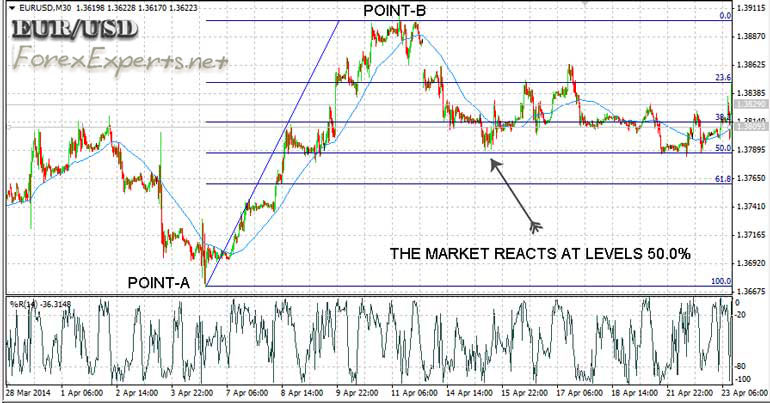
■ Point A marks the start of the swing (Point A in the chart below)
■ Point B marks the local high of the swing (Point B in the chart below)
That’s all. Once these two points are placed, the retracement levels will appear automatically.
At a glance, you can now identify the three retracement levels on any chart:
■ 38.2% | 50.0% | 61.8%
In the following chart, you can see that the EURUSD market reacted at the 50.0% Fibonacci level. This is a common occurrence when trading Forex assets. Reversals often happen at the 50.0% or 61.8% retracement levels.
Step 2: Trading the Results of the Fibonacci Retracements
After applying the Fibonacci Retracements tool on the chart, you can trade the retracement levels in both directions. It is important to correctly identify the swing and place the two points (A, B) at the right levels.
When Trading the Upward and Downward References:
■ If the price is within a downward retracement swing, you sell the market
■ If the price is within an upward retracement swing, you buy the market
Timeframes:
You can trade in various timeframes depending on the size of the retracement:
→ Wide retracements should be traded on larger timeframes
→ Tight retracements suit smaller timeframes

🎯 Conclusions regarding the use of the Fibonacci Retracements Strategy
(1) You can use Fibonacci Retracements to trade any market (Forex, Stocks, Indices, Commodities) on any timeframe.
(2) It is crucial to place the two swing points accurately.
(3) This is a popular and effective strategy, but no strategy is 100% profitable. There is always a risk the market will move against you. Therefore, never risk more than 5-10% of your balance on any trade.
(4) It is recommended to test this strategy on a demo account before trading with real money.
(5) You can use additional technical analysis tools to confirm signals generated by Fibonacci Retracements.
(6) Once a signal is confirmed, execute your trade quickly.
(7) The 50.0% and especially the 61.8% Fibonacci levels are the most important retracement levels.
(8) When trading with this strategy, avoid major macroeconomic news releases. You can track these using an online economic calendar.
◙ Fibonacci Retracements Trading Strategy
ForexExperts.net
🔗 READ MORE
» Introduction to Trading Strategies
♞ DAY-TRADE STRATEGIES
» Falsebreak Candle
» Bollinger-RSI
» Stochastic Day-Trade
» Breakout Strategy
♚ SWING-TRADE STRATEGIES
» Riding the Trend
» Moving Envelopes
» MACD Swing
♜ SCALPING STRATEGIES
» Stochastic Scalper
» Bollinger-RSI Scalping
» Hit-Run Trading
♟ STRATEGIES FOR BEGINNERS
» News-Trading
» Follow-The-Trend
» Support and Resistance
» Fibonacci Retracements
» Stochastics Trading
» Chart Patterns
💱 MARKET CORRELATIONS
» US Yields and USDCHF
» Crude Oil and Forex
» USDJPY and US Stock Indices
» AUD and Gold Price Correlation